

For consultants, investment analysts, and corporate operators, the path from raw information to a finished presentation is notoriously tedious. You start with a chaotic mix of client interview notes, financial data dumps, and operational bullet points. To turn this into an executive-ready slide, you typically have to read through the clutter, extract the core narrative, manually build charts in Excel, and spend hours aligning text boxes in PowerPoint.
AutoPresent changes this workflow entirely. By converting unstructured notes directly into structured, editable presentation slides, it eliminates the friction of manual slide design.
In this article, we will break down the exact workflow demonstrated in our latest video, showing how a messy "diligence dump" is transformed into a high-caliber consulting slide with a single prompt.
The Problem: The "Diligence Dump" Bottleneck
In professional services and corporate development, raw data rarely arrives in a clean format. It usually looks like this: a block of text containing a mix of historical financial figures, customer concentration metrics, operational risks, and supply chain concerns.
Before you can even begin designing a slide, you have to perform cognitive heavy lifting:
- Data Extraction: Pulling out financial figures across multiple fiscal years.
- Information Hierarchy: Separating high-level strategic risks from minor operational details.
- Visual Layout Choice: Deciding whether to use a chart, a table, or structured columns to make the slide readable.
When you are on a tight deadline for an Investment Committee (IC) meeting or a client update, this manual process becomes a major bottleneck.
The Workflow: From Chaos to Clarity in Three Steps
The video demonstrates how AutoPresent automates this transition while maintaining the analytical rigor required for executive audiences.
Step 1: Upload Your Raw Source Material
The process begins with your raw notes. In the demonstration, the user locates a file named RoughNotes.png—a simple screenshot of unstructured text containing diligence notes for a target company ("Target Co").
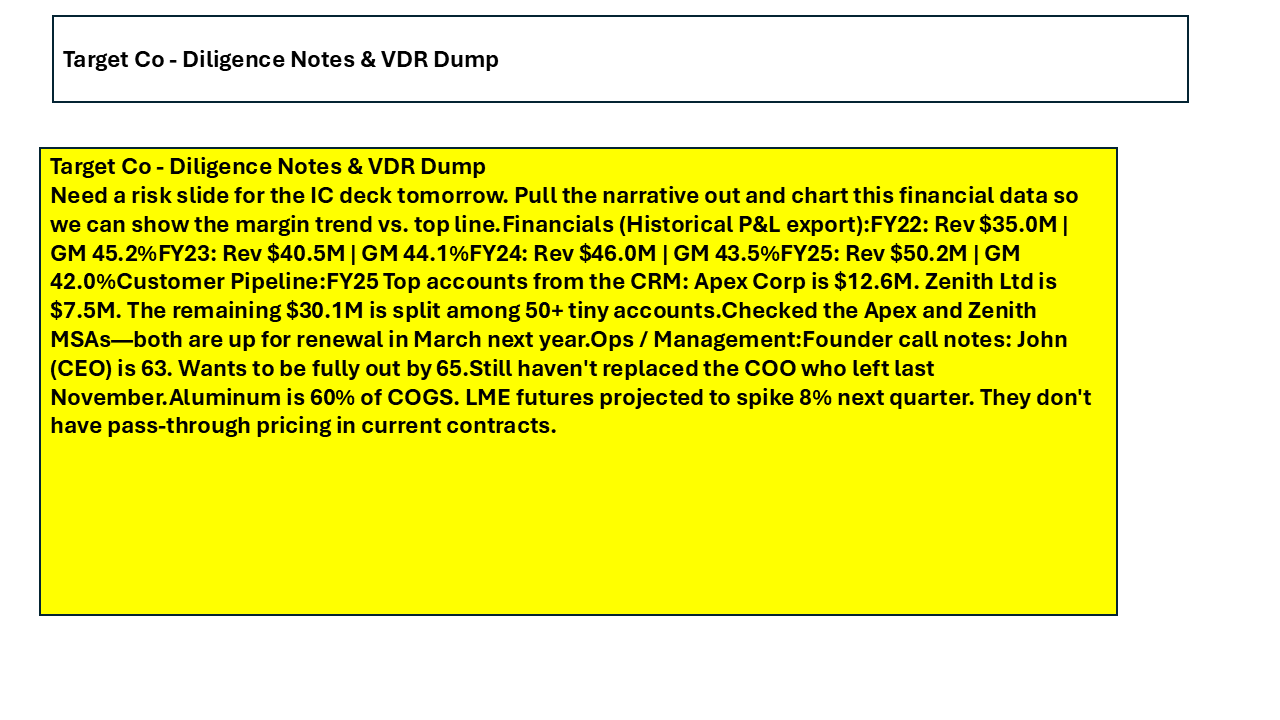
The raw text contains a dense mix of information:
- Financials: Revenue and Gross Margin figures for FY22 through FY25.
- Customer Pipeline: Revenue concentration details regarding "Apex Corp" and "Zenith Ltd," along with upcoming contract renewal dates.
- Operations & Leadership: Notes on the CEO’s retirement plans and a vacant COO position.
- Supply Chain: Details on aluminum cost exposure and pricing contract limitations.
Step 2: Write a Simple Prompt
Instead of manually rebuilding these points, the user uploads the image to AutoPresent and types a straightforward instruction:
"Can you please convert my notes into a polished slide that outline risks for my IC deck."
Step 3: AutoPresent Generates the Slide
AutoPresent processes the unstructured text, extracts the underlying data, analyzes the strategic risks, and generates a structured, professional slide layout.
The Transformation: Analyzing the Output
The transition from the raw input to the final slide highlights the analytical capabilities of AutoPresent. It does not simply restyle the text; it reorganizes the information logically and visually.
Before: Unstructured Text Dump
Target Co - Diligence Notes & VDR Dump
Need a risk slide for the IC deck tomorrow. Pull the narrative out and chart this financial data so we can show the margin trend vs. top line. Financials (Historical P&L export); FY22: Rev $35.0M | GM 45.2% FY23: Rev $40.5M | GM 44.1% FY24: Rev $46.0M | GM 43.5% FY25: Rev $50.2M | GM 42.0% Customer Pipeline: FY25 Top accounts from the CRM: Apex Corp is $12.6M. Zenith Ltd is $7.5M. The remaining $30.1M is split among 50+ tiny accounts...
After: The Polished Consulting Slide
The generated slide is structured exactly like a deliverable from a top-tier management consulting firm:
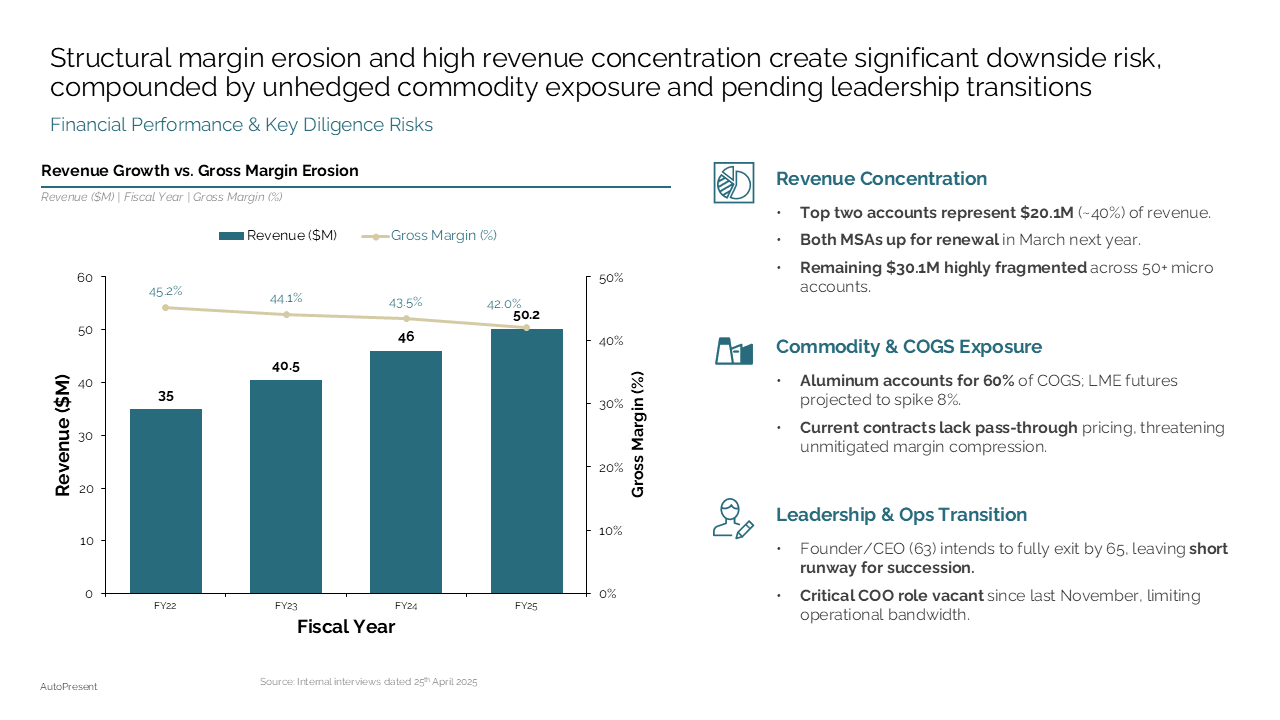
- Action Title: Rather than a generic title like "Risk Summary," AutoPresent writes a synthesis-driven headline: "Structural margin erosion and high revenue concentration create significant downside risk, compounded by unhedged commodity exposure and pending leadership transitions."
- Dual-Axis Data Visualization: On the left, the tool automatically plots the financial data. It builds a dual-axis chart showing Revenue Growth vs. Gross Margin Erosion from FY22 to FY25, clearly illustrating the downward margin trend against rising top-line revenue.
- Categorized Risk Matrix: On the right, the qualitative notes are organized into three clean, readable categories:
- Revenue Concentration: Highlights that the top two accounts represent ~40% of revenue and notes the upcoming March renewals.
- Commodity & COGS Exposure: Calls out that aluminum represents 60% of COGS and notes the risk of unhedged pricing contracts.
- Leadership & Ops Transition: Outlines the CEO's planned retirement and the vacant COO role.
Key Benefits of AutoPresent for Professionals
- No More Manual Chart Building: AutoPresent reads raw financial figures from your text or images and automatically generates the correct chart type (such as dual-axis bar and line charts) to show trends.
- Fully Editable Outputs: The resulting slide is not a flat image. The text boxes, shapes, chart data, and visual hierarchy remain fully editable, allowing you to make quick refinements before your meeting.
- Consistent Visual Standards: The tool applies clean alignment, professional color contrast, and clear typographic hierarchy automatically, ensuring your slides look executive-ready without requiring a designer.
- Reduced Time-to-Draft: By automating the initial structuring and design phase, you can move from raw data to a complete draft in a fraction of the time.
Versatile Use Cases
While the primary demonstration focuses on an Investment Committee risk slide, the video highlights several other complex layouts that AutoPresent handles seamlessly:
Software & Architecture Diagrams
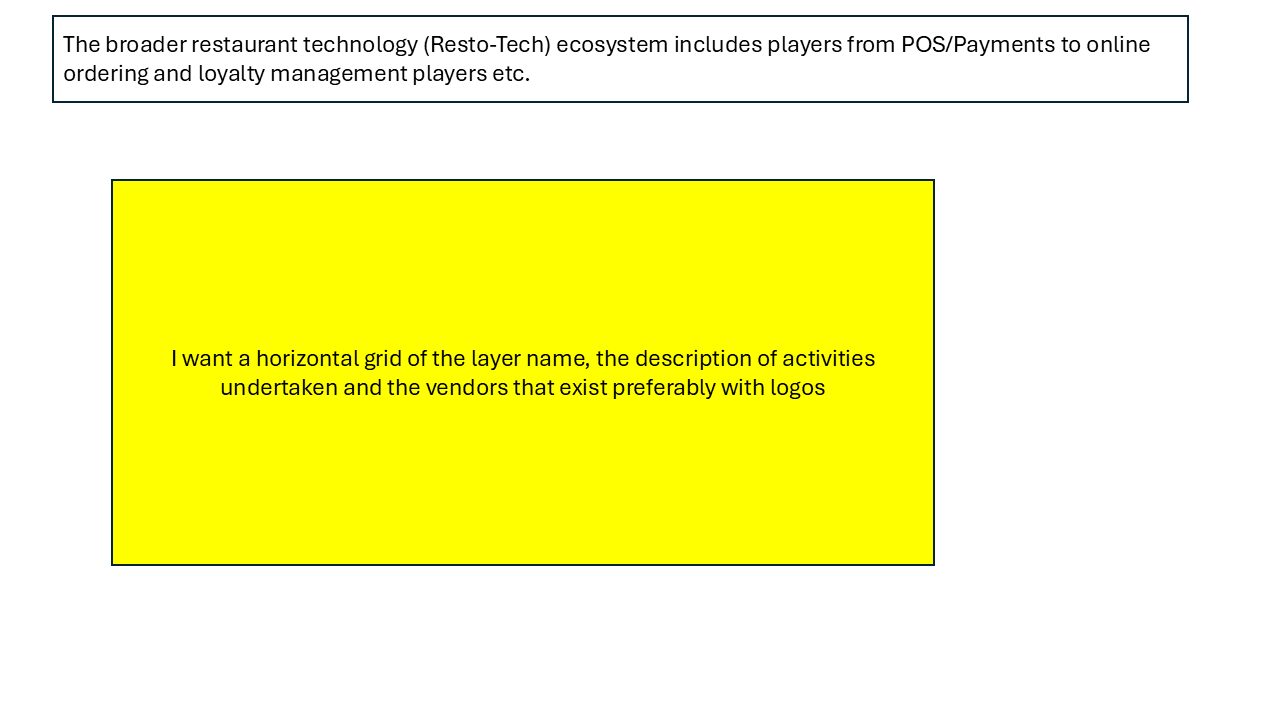
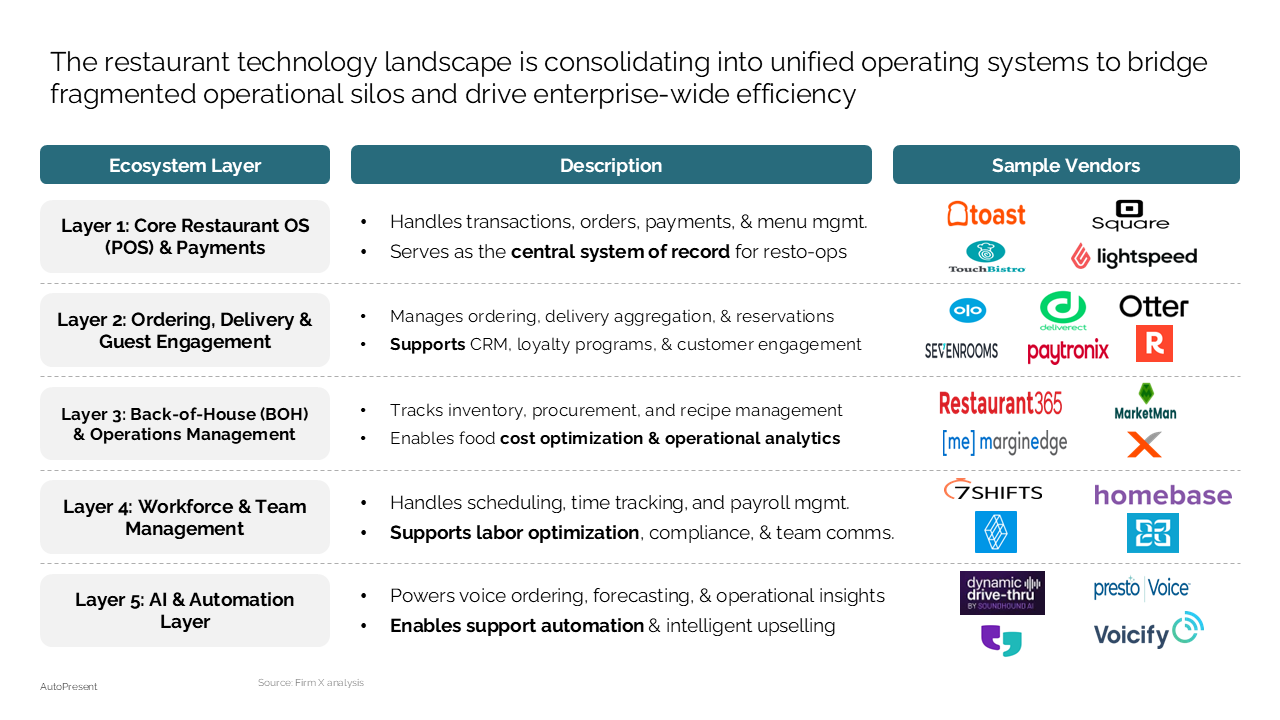
Convert a hand-drawn sketch or structured text layer layout into a clean, multi-layered industry landscape diagram complete with vendor logos.
Project Timelines & Milestones
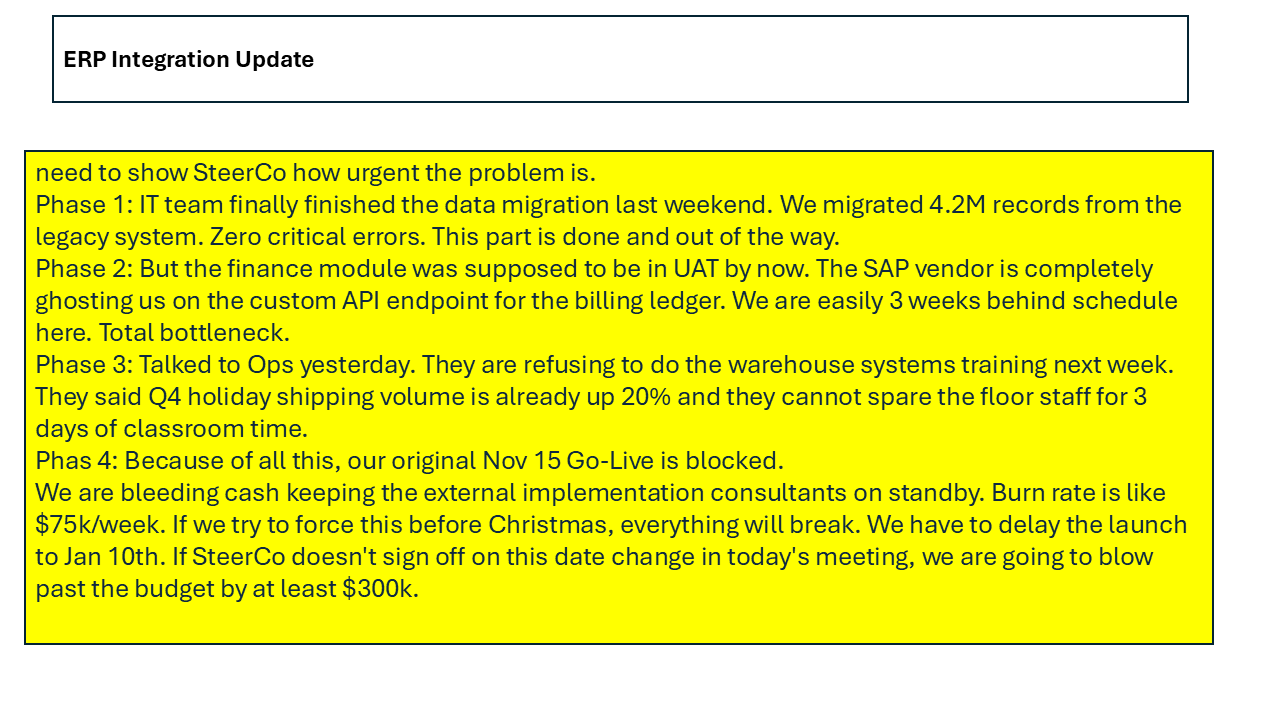
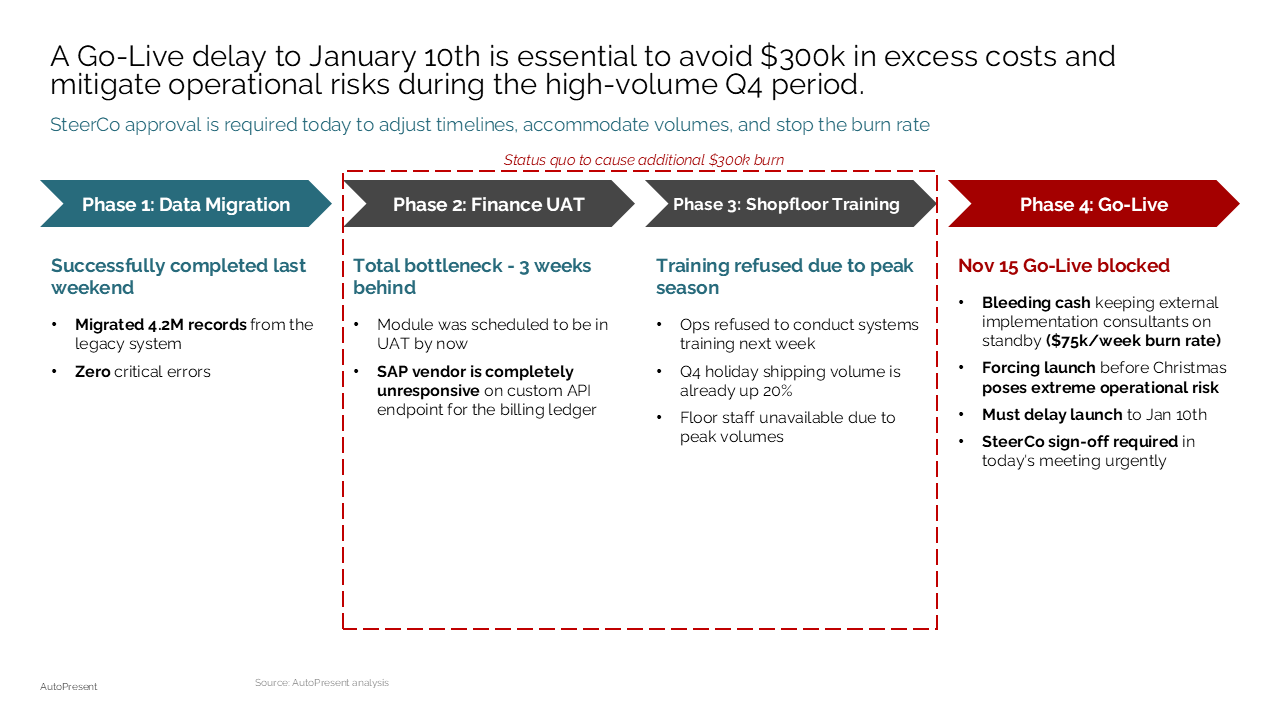
Transform unstructured project updates, such as a delayed ERP integration, into a clear horizontal phase diagram for leadership review.
Pitch Deck Financials
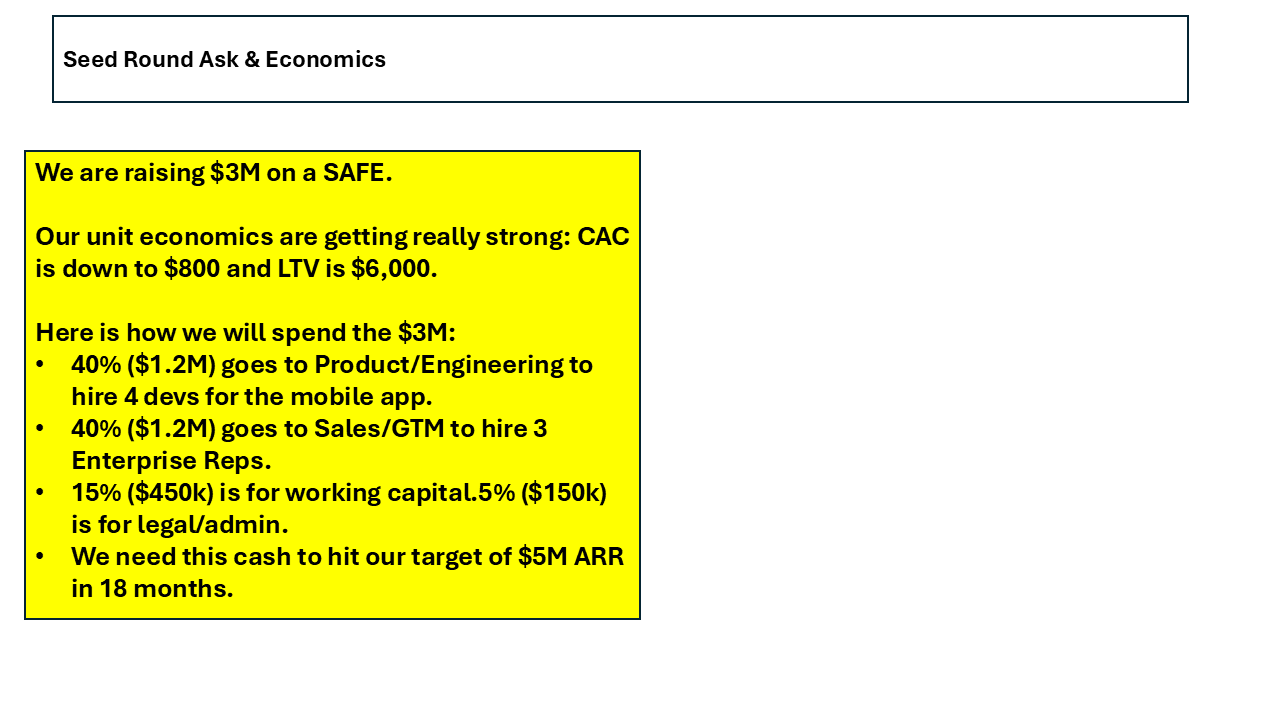
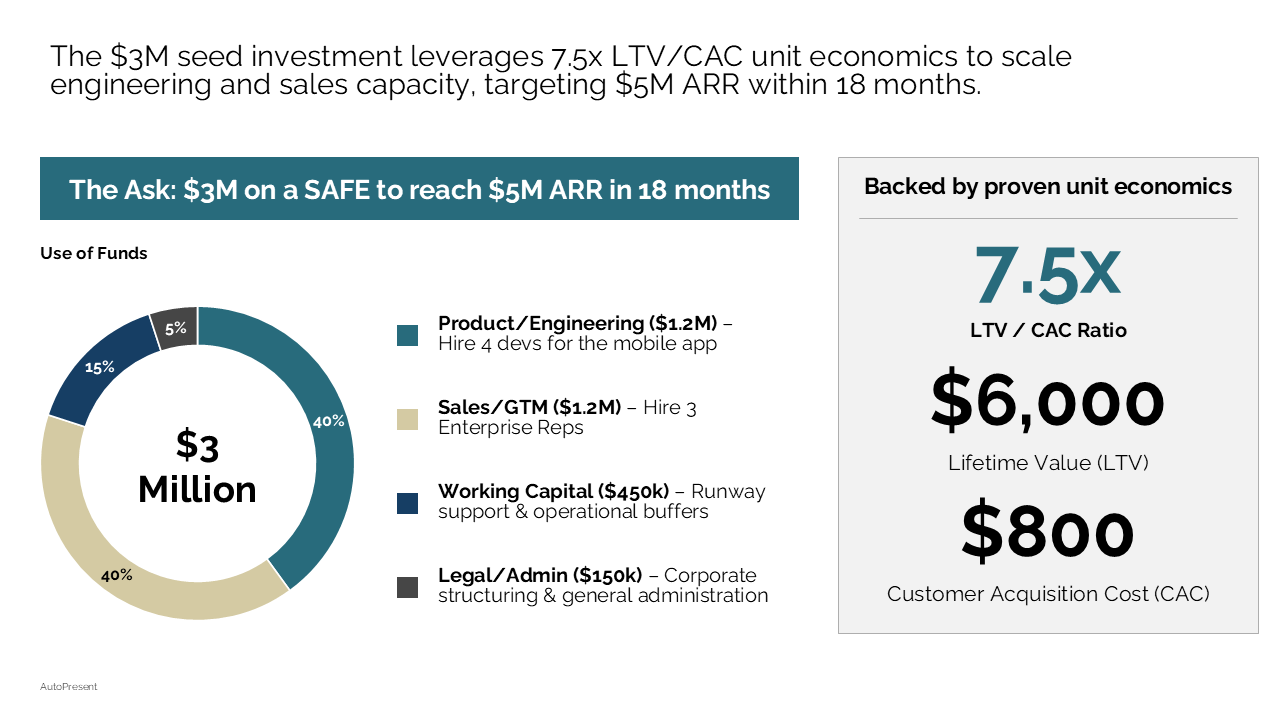
Convert a basic funding announcement text block into a structured "The Ask" slide, complete with use-of-funds visuals and key customer acquisition metrics.
Frequently Asked Questions
Is the generated slide a static image, or can I edit it?
The generated slide is fully editable. You can modify the text, adjust the layout, change colors, and update the chart data directly within your presentation editor. It is designed to fit seamlessly into your existing workflow.
Can AutoPresent read hand-written notes or screenshots?
Yes. As shown in the video, AutoPresent can process images (such as PNGs or JPEGs) of text, screenshots of documents, and rough sketches, extracting both the qualitative text and quantitative data to build your slides.
Do I need to format my data before uploading it?
No. You can upload a raw "bullet dump," meeting transcript, or unformatted notes. AutoPresent is designed to parse unstructured information, identify the key themes, and organize them into a logical layout.