Slide topic
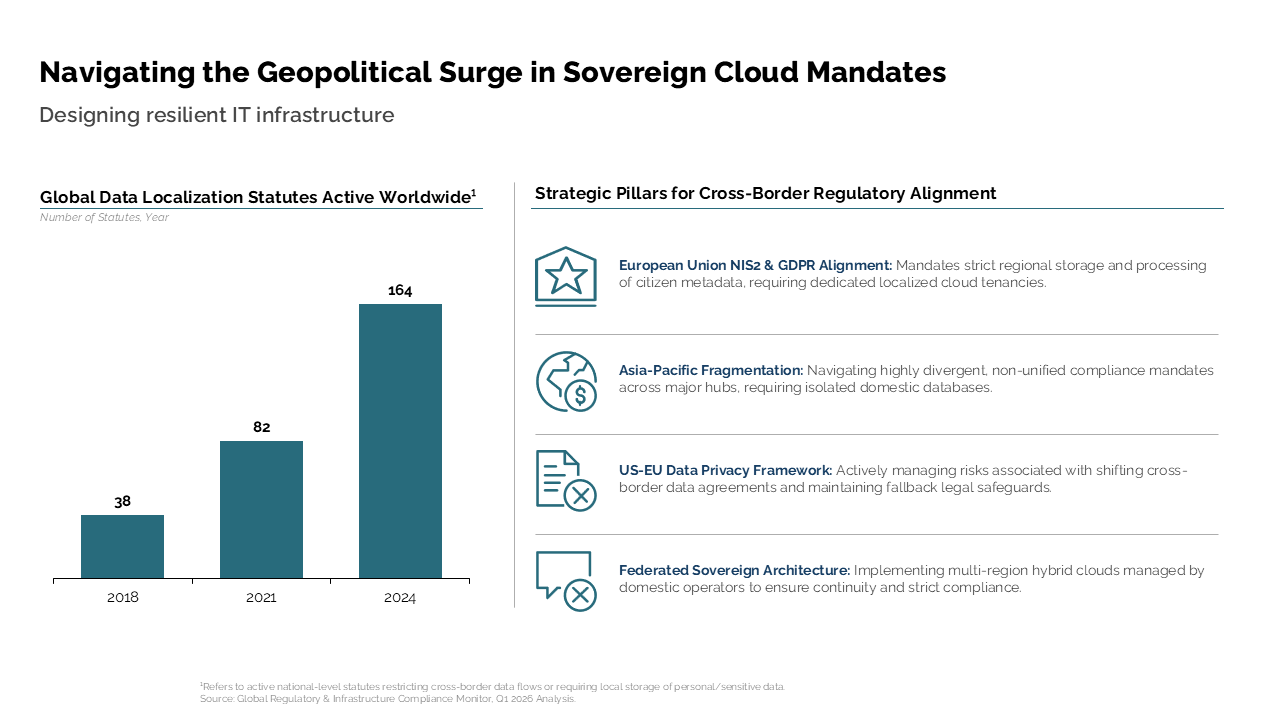
A two-column slide showing global data localization growth via bar chart and four strategic pillars for regulatory alignment

Slide topic
Continue browsing
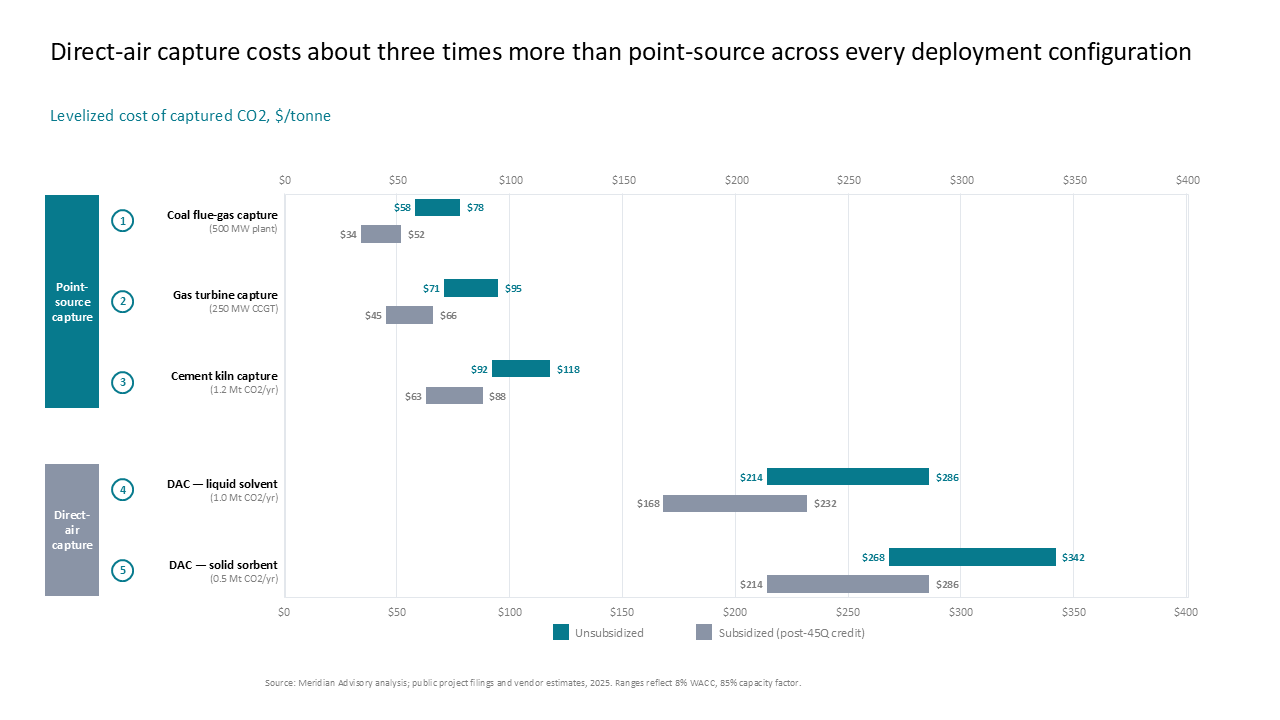 Horizontal range chart comparing unsubsidized and subsidized cost ranges for point-source and direct-air carbon capture technologies
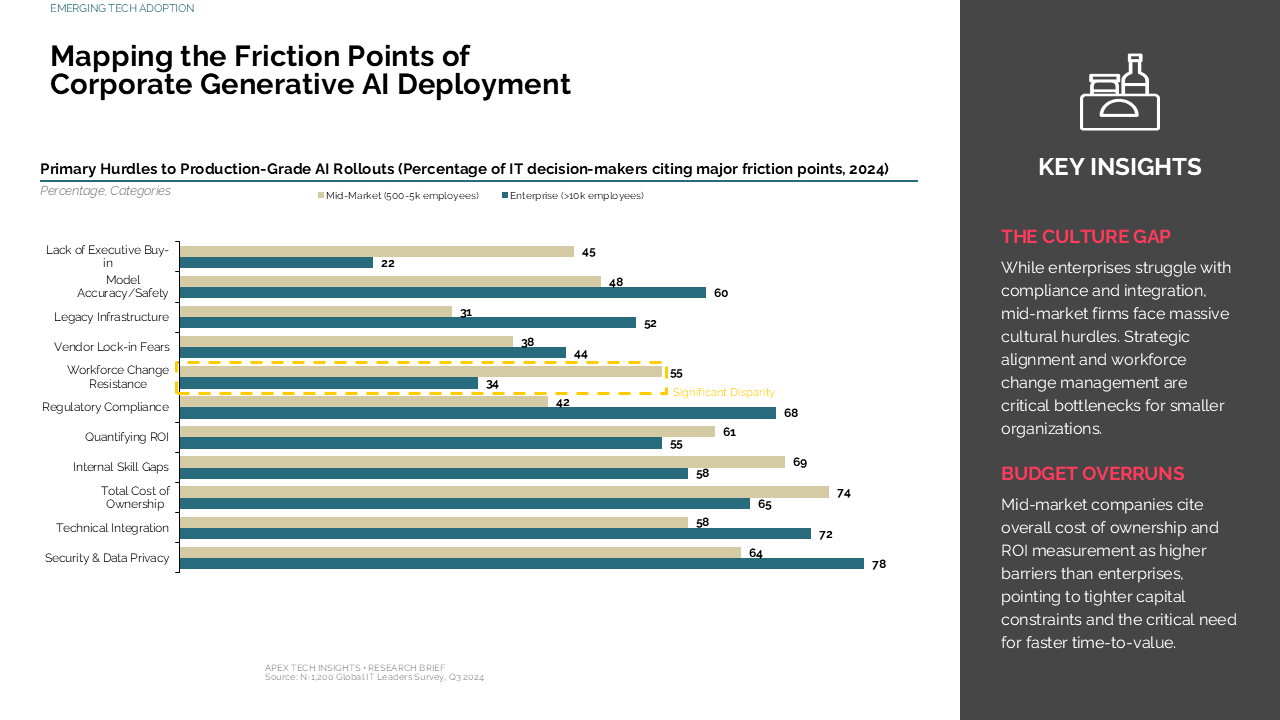 Horizontal grouped bar chart comparing enterprise and mid-market AI deployment hurdles with a right-side key insights sidebar
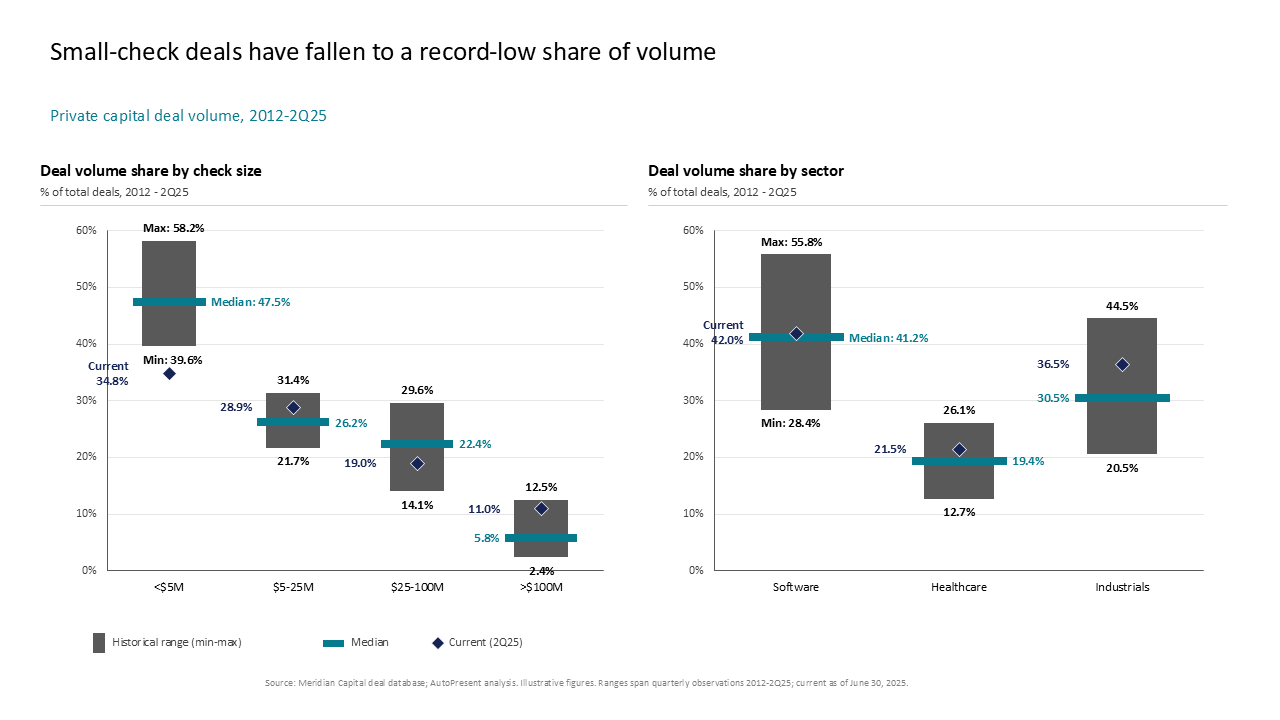 This slide uses dual range charts to compare private capital deal volumes by check size and sector against historical min, max, and medians
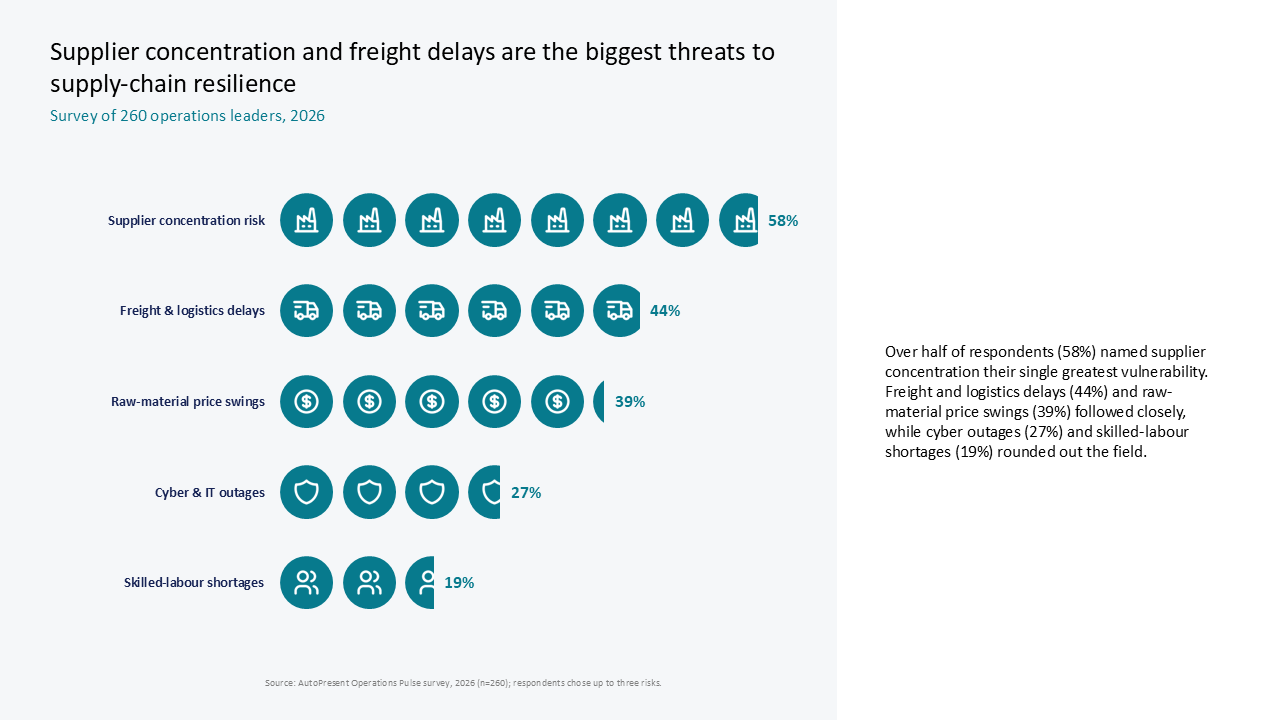 Supply chain resilience survey results visualized with an icon-based horizontal bar chart and a right-side narrative summary