Slide topic
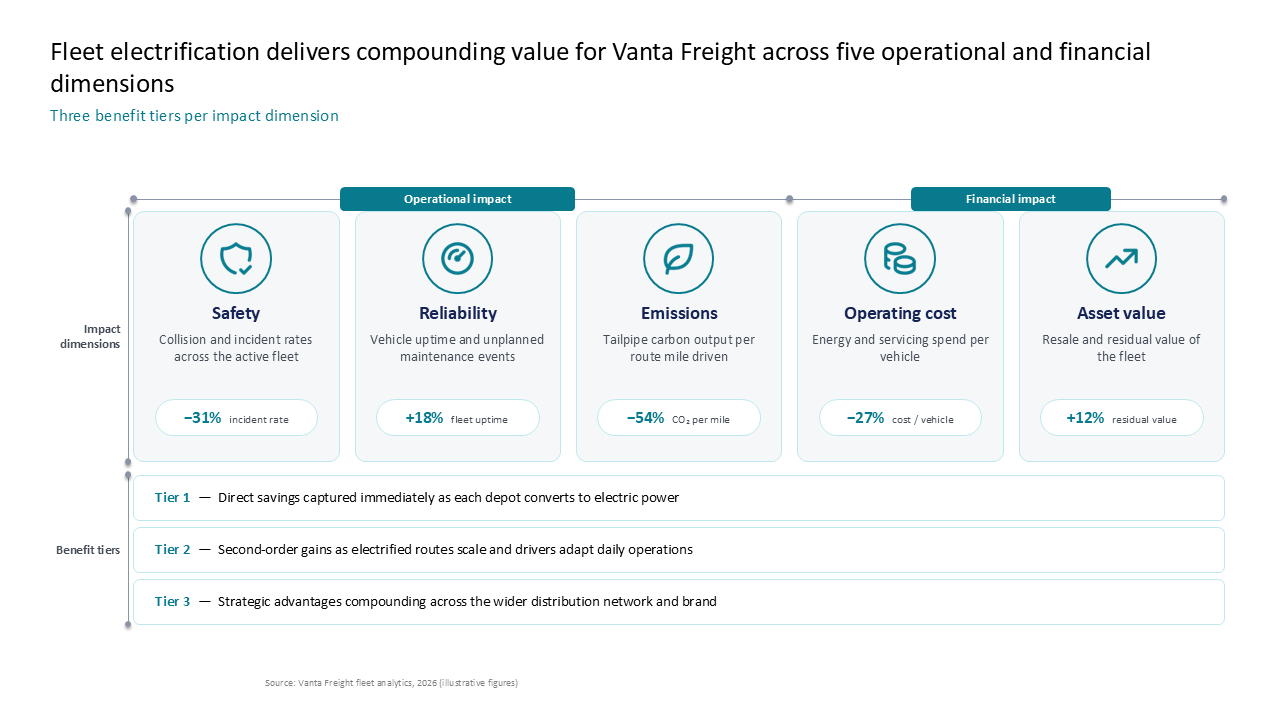
Fleet electrification impact assessment using grouped cards and a three-tier benefit framework

Slide topic
Continue browsing
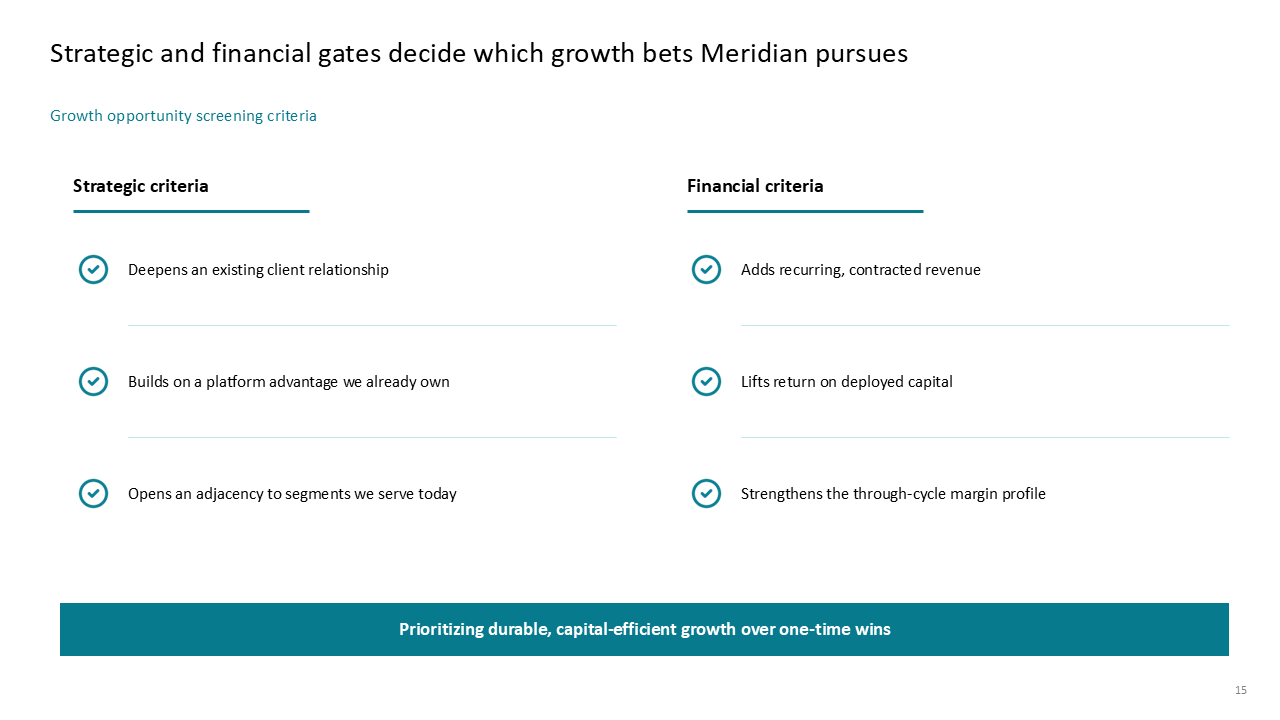 Two-column criteria framework comparing strategic and financial gates for evaluating growth bets, featuring a bottom summary banner
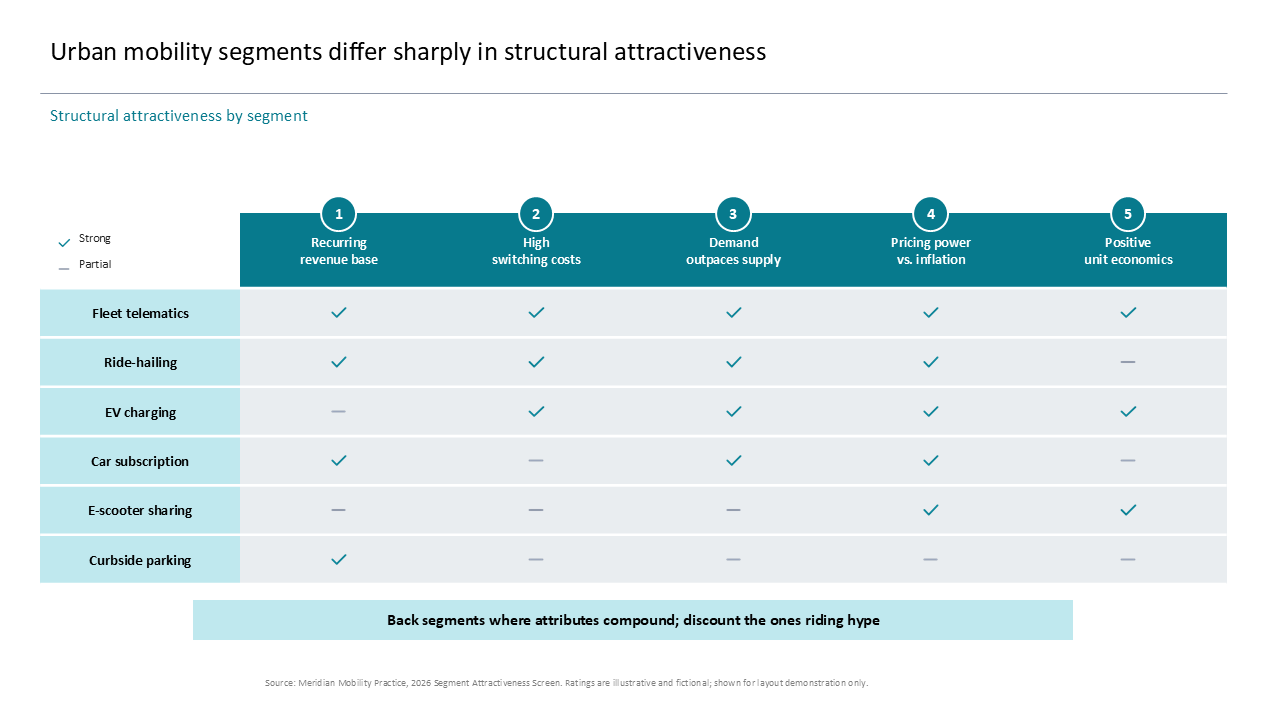 Matrix comparing urban mobility segments against attractiveness criteria using a checkmark evaluation table and bottom summary box
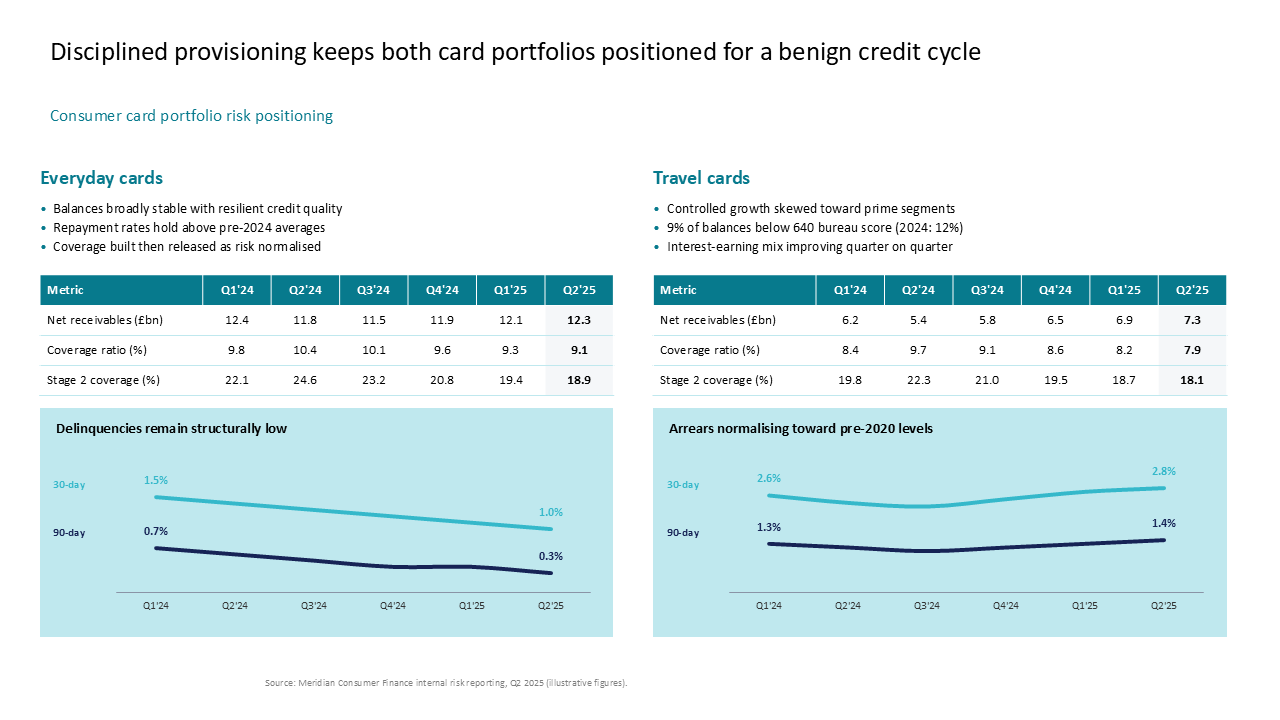 Risk assessment comparing everyday and travel cards using vertical tables and line charts to track delinquency trends
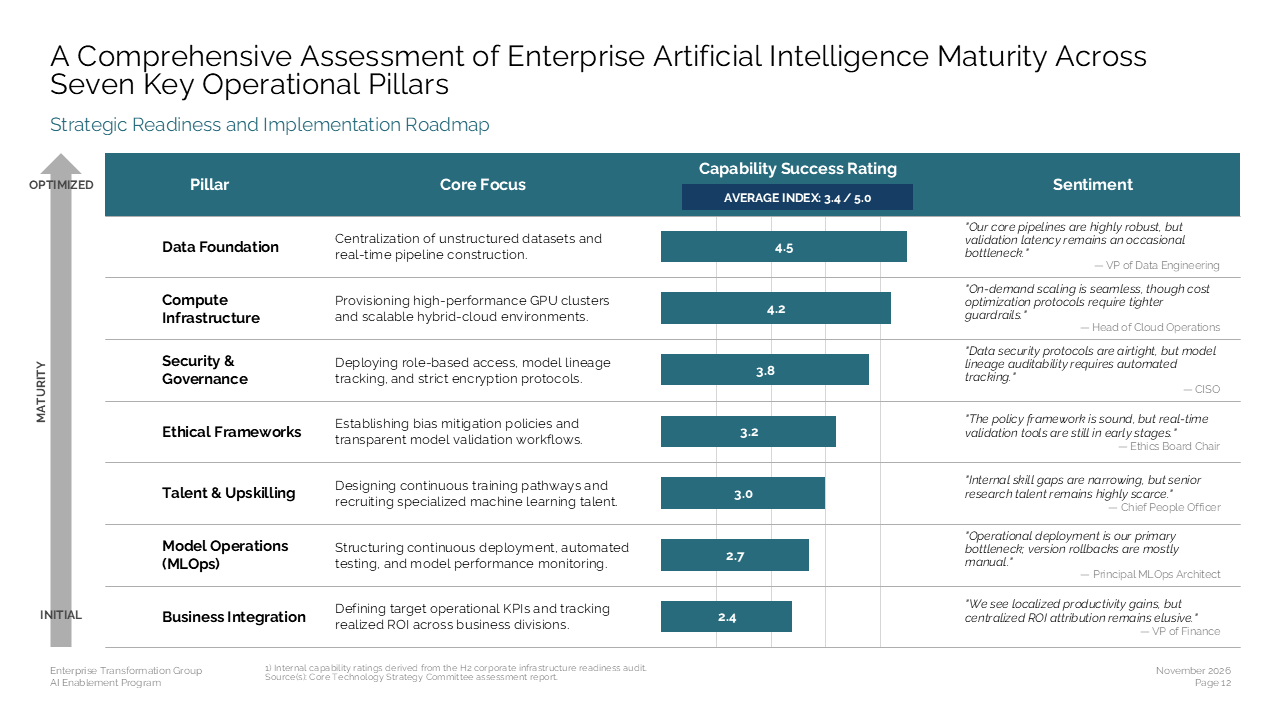 Table showing AI maturity scores across seven operational pillars with a vertical maturity arrow and sentiment analysis